


A shop owner who wants to know which product sells best, a service business that tracks leads by channel, and a small team that reports to investors all face the same problem. The numbers sit in spreadsheets, and turning them into a chart takes hours a small business does not have. The best ai data visualization tools for small businesses in this guide turn a spreadsheet upload into a clear chart and a plain language summary in minutes. Tableau leads this ranking on the combined score, with Microsoft Power BI close behind for businesses already using Microsoft tools.
We judged each tool on real business data rather than a sales demo. That meant a year of shop sales, a lead list by channel, and a monthly cash flow sheet. We tracked how fast a useful chart appeared, how accurate the AI summary was, and how the dashboard looked when shared with a partner.
Tableau earns the top spot on chart quality, Power BI on value inside Microsoft, and every tool after them on a strength of its own. Some are full business intelligence platforms. Others are light tools that turn one spreadsheet into a chart fast. The right pick depends on your data size, your team habits, and how much of the analysis you want the AI to do.
Tableau tops the combined score, yet a business that charts one kind of data every week should let the best pick by job table near the end carry equal weight. A tool that ranks sixth overall can still be the right answer for a shop owner, while the overall winner can be too much for a team that only needs a monthly sales chart.
In this article
- The 8 Tools at a Glance
- Why the Best AI Data Visualization Tools for Small Businesses Pay for Themselves
- How We Put Each Data Visualization Tool Through Its Paces
- The 8 Tools in Detail
- Charts, Predictions and Stories: What the Best AI Data Visualization Tools for Small Businesses Must Do
- Spreadsheet Uploads and Live Data: Where Each Tool Stops Short
- Five Dashboard Mistakes That Hide the Real Numbers
- A Two Week Plan for Testing a Tool on Your Own Sales Data
- Best Pick by Job
- Frequently Asked Questions
- Tableau Leads, but Your Data Makes the Final Call
The 8 Tools at a Glance
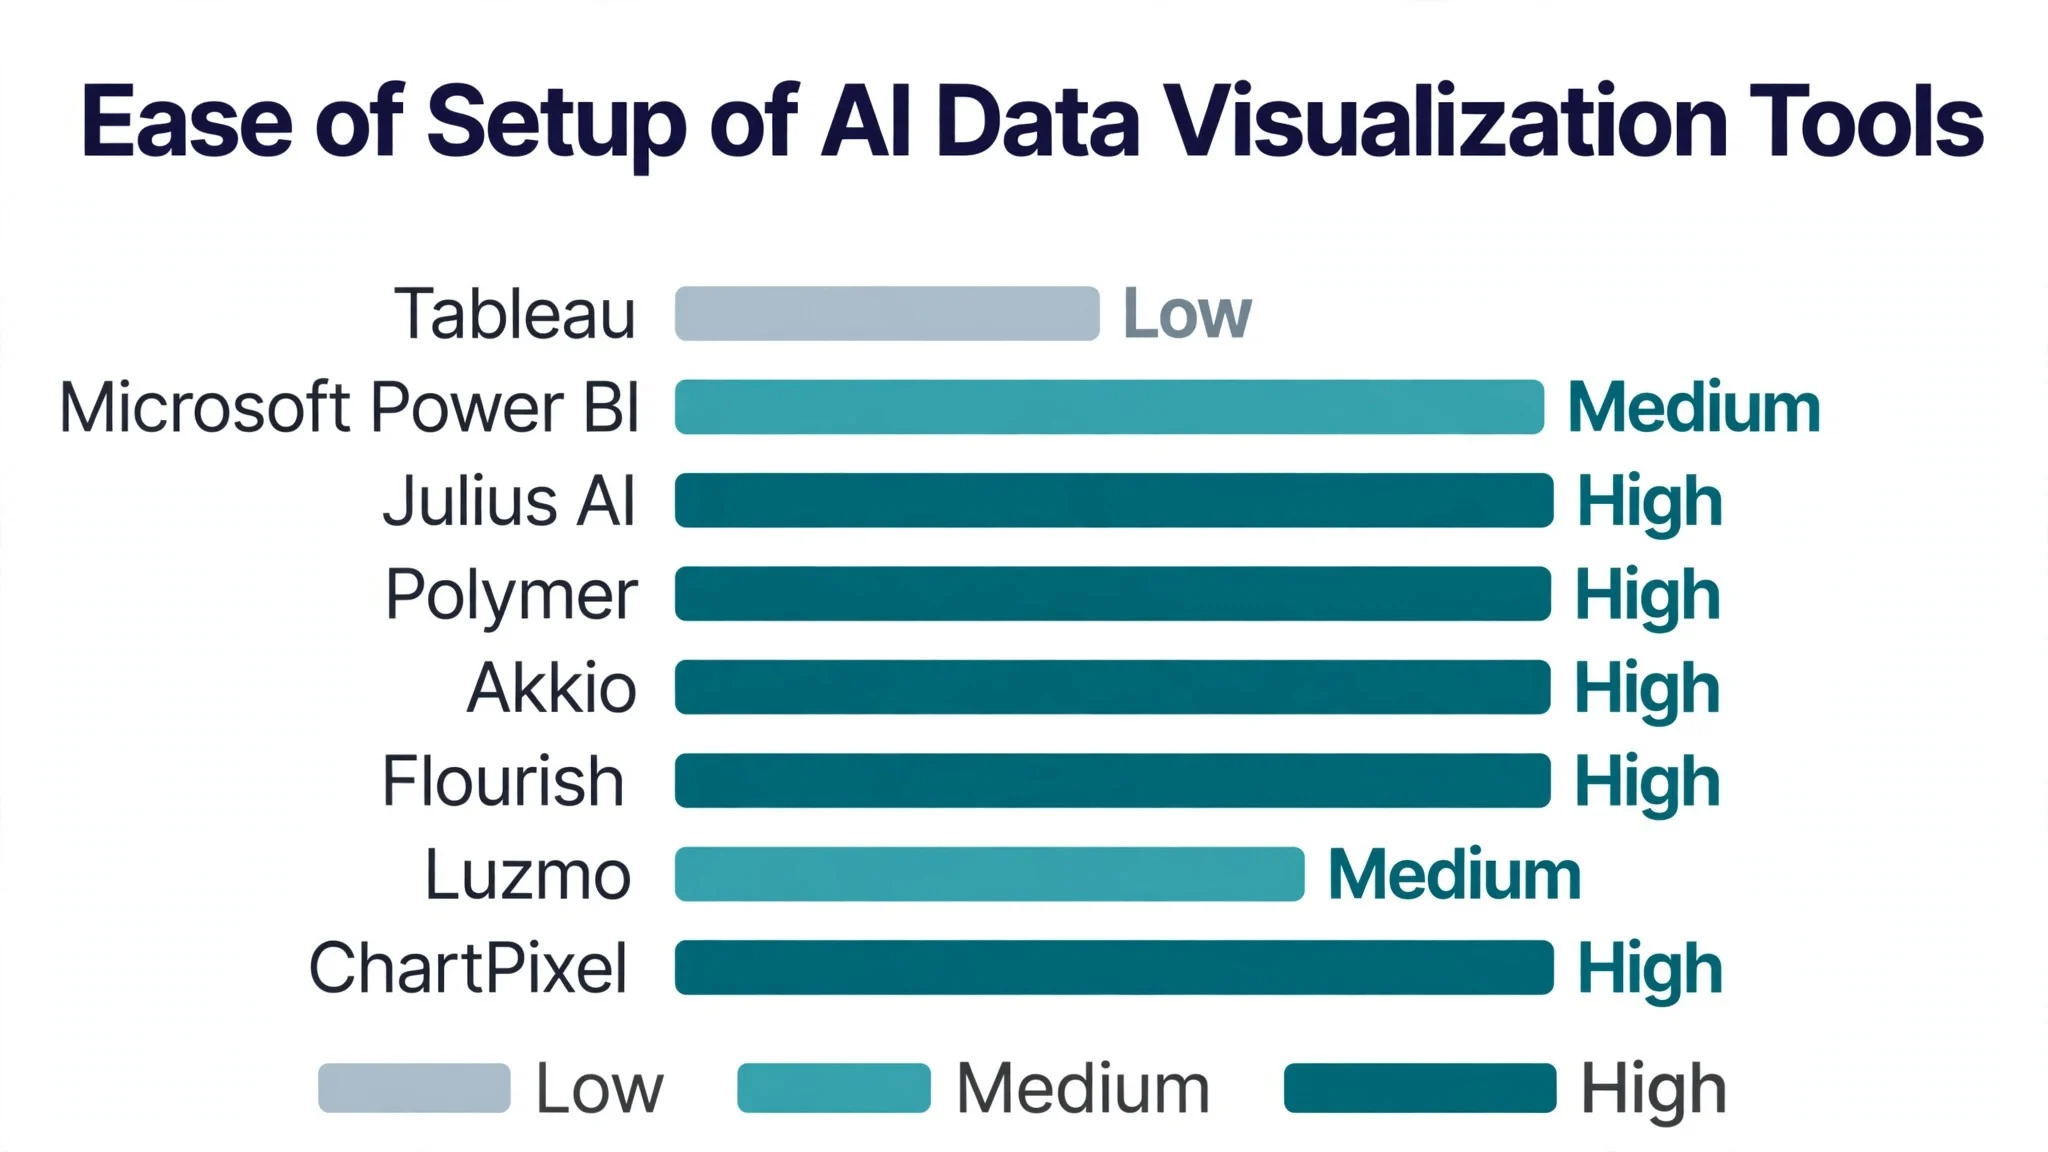
The table below lists one row per tool, with the price shape, the natural fit, and the strength that put Tableau first. The best ai data visualization tools for small businesses are not all built for the same business, and the table shows why. Tableau leads on chart depth, while Julius AI wins for owners who want answers from a spreadsheet fast.
| Tool | Starting price | Best for | Standout strength |
|---|---|---|---|
| Tableau | Pricing on the vendor site | Businesses that want deep dashboards | Deepest charts with AI help |
| Microsoft Power BI | Free plan; paid plans on the vendor site | Businesses already on Microsoft | Strong value inside Microsoft 365 |
| Julius AI | Free plan; paid plans on the vendor site | Owners who want fast answers | Chat with your spreadsheet |
| Polymer | Free plan; paid plans on the vendor site | Small teams that want quick dashboards | Fast dashboards from a sheet |
| Akkio | Free plan; paid plans on the vendor site | Teams that want predictions | Chat, prediction and reporting together |
| Flourish | Free plan; paid plans on the vendor site | Businesses that publish charts | Beautiful charts for the web |
| Luzmo | Free plan; paid plans on the vendor site | Software teams embedding analytics | Embedded analytics for customers |
| ChartPixel | Free plan; paid plans on the vendor site | Owners who want charts plus insights | Auto charts with written insights |
Start with Tableau and Power BI, then read those two reviews to see which analysis style fits your business. A tool that scores High on chart quality only helps if your reports need depth, and a tool that scores High on AI insight only helps if you trust the summary. Fit to your data matters more than a long feature list.
Why the Best AI Data Visualization Tools for Small Businesses Pay for Themselves
The best ai data visualization tools for small businesses pay for themselves in the same place, which is the decision made a week earlier. A shop owner who sees a falling product line in a chart can act before the stock piles up, while an owner who reads the same numbers in a spreadsheet may miss it for a month. A chart that shows the truth fast pays for the subscription many times over.
The second reason is the end of the manual report. A small team that builds the same monthly report by hand loses a day every month, and the numbers are stale by the time the report lands. A dashboard that refreshes itself gives the owner live numbers without the manual work.
Speed of response is the third reason. When a partner asks which channel brings the best leads, a business with a live dashboard answers in seconds. A business working from spreadsheets has to build the chart first, and the partner is already doubting the numbers.
The fourth reason is proof for the next decision. A tool that records every chart, every trend, and every forecast gives a small business real numbers for the next hire or the next product order. The best ai data visualization tools for small businesses in this guide all keep that history, so a small team can show exactly why it chose a direction.
The final reason is calmer month ends. People do better work when the numbers arrive as a clear chart rather than a long sheet, because the discussion starts from the facts instead of an argument about the data. A clear dashboard that matches the business beats a long spreadsheet, and the tools in this ranking all help a team keep the numbers honest.
How We Put Each Data Visualization Tool Through Its Paces
We tested the best ai data visualization tools for small businesses against the same five measures, using a year of shop sales, a lead list by channel, and a monthly cash flow sheet. Each tool ran the same workload for two weeks, so Tableau and the rest compare like with like.
- Chart quality, judged by how clear and readable the charts were on a laptop and a phone.
- AI insight accuracy, measured by how often the written summary matched what the data actually showed.
- Data connection ease, scored on whether the tool linked to a spreadsheet or a live source without help.
- Sharing ease, timed from a finished dashboard to a link a partner could open without a login.
- Daily usability, judged by how long the first chart took and how often the team needed to ask for help.
Each measure carried equal weight except chart quality, which counted double, because a tool that draws confusing charts is not doing its job. Scores run out of 100, and the order below follows the combined total, led by Tableau on chart quality. Where two tools tied, we broke the tie on AI insight accuracy, since a wrong summary misleads the owner.
We also checked the export options, because business charts end up in presentations and reports. The best tools in this ranking export clean images and slides, while the weakest leave the owner screenshotting the screen.
The 8 Tools in Detail
Each review below follows the same pattern, and every tool is judged on the same ground as the best ai data visualization tools for small businesses. We note what each tool does best, where it falls short, and the business it suits best, with chart quality carrying the most weight.
1. Tableau
Tableau is the chart leader in this ranking, and it leads because it draws the clearest dashboards of any tool here. A spreadsheet becomes a set of linked charts in minutes, the AI assistant suggests views the owner had not thought of, and the sharing links work for partners without a login. For a business that lives by its numbers, it is the natural standard.
The trade off is learning time. Tableau is built for analysts, so a small business owner with no data background may need a week to feel comfortable. The price also sits above the lighter tools here. For a business that reports often, that depth pays off.
Try it by uploading one year of sales data and building a dashboard for your best and worst products.
Our verdict. The clearest dashboards here, and the best all rounder for businesses that report often.
2. Microsoft Power BI
Microsoft Power BI is the value pick, and it earns second place by fitting neatly into Microsoft 365. A business that already uses Excel and Teams gets dashboards that pull from the same files, and the AI features answer plain language questions about the data. The price is the most forgiving of the full platforms here.
The trade off is polish outside Microsoft. Power BI is at its best inside the Microsoft world, so a business that runs on Google tools gets less from it. For a Microsoft business, the connection is the reason to choose it.
Try it by connecting one Excel sales sheet and asking the AI which month performed best.
Our verdict. The best value inside Microsoft here, ideal for businesses already on Microsoft 365.
3. Julius AI
Julius AI is the fast answer pick, and it earns third place by letting an owner chat with a spreadsheet. Upload a file, ask what drove sales last quarter, and the tool returns charts plus a short written answer. The speed suits an owner who needs an answer before a meeting, not a dashboard project.
The trade off is dashboard depth. Julius AI answers questions brilliantly but builds lighter standing dashboards than Tableau or Power BI, so a business that needs a shared monthly report may want more. For a quick answer, it is the fastest tool in this ranking.
Try it by uploading one messy sales file and asking three questions a partner might ask.
Our verdict. The fastest answers from a spreadsheet here, ideal for owners who need a quick read.
4. Polymer
Polymer is the quick dashboard pick, and it suits small teams that want a dashboard without a BI project. Upload a sheet, and the AI builds charts, filters, and a shareable board in minutes. The speed suits a team that needs a weekly view of sales or leads without hiring an analyst.
The trade off is analysis depth. Polymer builds dashboards fast but offers less deep analysis than the leaders, so a business that needs forecasts or complex joins will find it thin. For a weekly sales view, that speed is exactly right.
Try it by uploading one lead list and building a board that shows leads by channel.
Our verdict. The fastest small team dashboards here, ideal for teams that want a weekly view.
5. Akkio
Akkio is the prediction pick, and it earns its place by going beyond charts into forecasts. The AI builds predictive models without code, answers plain language questions, and turns the result into reports that refresh. The combination suits a business that wants to know what happens next, not just what happened.
The trade off is focus. Akkio now presents itself as a workflow platform for agencies, so a small business that only wants charts may find the extra surface distracting. For a business that wants predictions, it is the most forward looking tool in this ranking.
Try it by uploading one year of sales and asking the tool to forecast the next quarter.
Our verdict. The best predictions plus reporting here, ideal for businesses that plan ahead.
6. Flourish
Flourish is the publishing pick, and it earns its place with charts that look beautiful on the web. A business can build an interactive chart, embed it on a site or in a report, and let readers explore the data themselves. The templates cover maps, bars, and stories, and the results look professional without a designer.
The trade off is analysis. Flourish publishes brilliantly but analyses lightly, so a business that needs deep joins or forecasts must prepare the data elsewhere. For a business that shares charts with customers or investors, that polish is the point.
Try it by turning one sales table into an interactive chart and embedding it on your site.
Our verdict. The most beautiful published charts here, ideal for businesses that share data publicly.
7. Luzmo
Luzmo is the embedded pick, and it suits software teams that put analytics inside their own product. A customer can ask a question in plain language and receive a visual answer computed from governed business logic, rather than a guessed query. The embedding suits a business that sells software and wants its customers to see their own numbers.
The trade off is fit for a single business. Luzmo is built for embedding inside a product, so a small business that only needs its own dashboard will find it the wrong shape. For a software team, it is the most focused tool in this ranking.
Try it by embedding one customer dashboard and asking a test question in plain language.
Our verdict. The best embedded analytics here, ideal for software teams serving customers.
8. ChartPixel
ChartPixel is the simple pick, and it rounds out the ranking for owners who want charts plus written insights without a BI setup. Drop in an Excel or CSV file, and the tool cleans missing values, picks chart types, and surfaces patterns with a short written explanation. The one click PowerPoint export suits an owner who presents to a partner.
The trade off is depth. ChartPixel is built for quick insights, so a business that needs live data connections or complex dashboards will outgrow it. For an owner who wants a fast read of a spreadsheet, that simplicity is exactly right.
Try it by uploading one messy survey file and reading the insights it surfaces.
Our verdict. The simplest spreadsheet to insight flow here, ideal for owners who want a fast read.
Charts, Predictions and Stories: What the Best AI Data Visualization Tools for Small Businesses Must Do
A data tool for a small business must cover three things, and the first is the chart itself. A chart should show the truth at a glance, with clear labels and honest scales, and the reader should understand it without a legend hunt. The best ai data visualization tools for small businesses in this guide all draw charts a partner can read in seconds, because a chart that needs explaining has failed.
The second is the prediction. A chart that shows last quarter is useful, but a forecast that shows next quarter is what a small business acts on. Akkio and ChartPixel lead here, while the pure chart tools leave forecasting to the owner. A business that orders stock or hires staff should weigh prediction as heavily as chart quality.
The third is the story. A dashboard that shows numbers without a written summary leaves the owner to interpret them alone, while a tool that writes a short plain language explanation turns numbers into a decision. Julius AI and ChartPixel both write useful summaries, and an owner who is not an analyst should weigh that as heavily as the charts.
The practical rule is simple. Demand charts a partner can read in seconds, ask for a forecast where the business plans ahead, and read the AI summary before trusting it. A business that follows those three rules makes faster decisions on better numbers.
One more check matters before you commit. Share a draft dashboard with a colleague who has never seen the data, and ask what decision they would make from it. If they reach the same conclusion you did, the charts are clear. If they hesitate, the dashboard needs fewer charts and clearer labels.
Spreadsheet Uploads and Live Data: Where Each Tool Stops Short
Spreadsheet uploads are the clearest dividing line in this ranking. Julius AI, ChartPixel, and Polymer turn a file into charts in minutes, while Tableau and Power BI expect a cleaner data setup. A business that lives in spreadsheets should start at the top of the upload friendly tools, because a tool that needs a data pipeline will not be used.
Live data carries its own limits. Some tools in this ranking refresh from a live source automatically, while others need a fresh upload every time the numbers change. A business that reports weekly on live sales should check the refresh options before committing, because a dashboard that shows last month numbers is worse than no dashboard at all.
Data cleaning decides how honest the result is. A tool that cleans missing values and flags odd entries protects the owner from a chart built on bad data, while a tool that charts whatever it is given can mislead. ChartPixel cleans well, and an owner with messy files should weigh that as heavily as chart beauty.
The honest test is to upload the same messy file to three tools and compare the weak spots. One may chart fast but clean poorly, another may clean well but draw plain charts, and a third may draw beautifully but need a perfect file. Knowing where each tool stops short matters more than knowing where it shines, because the weak spot is where a wrong decision starts.
Five Dashboard Mistakes That Hide the Real Numbers
The first mistake is charting everything at once. A dashboard with twelve charts hides the one number that matters, while a dashboard with three clear charts tells the story. Pick the three numbers the business lives by, and chart those first.
The second mistake is trusting the AI summary without checking it. An AI summary can misread a spike or miss a seasonal pattern, and an owner who repeats the summary to a partner owns the error. Read the chart yourself before you quote the summary.
The third mistake is using a pie chart for a trend. A pie shows a share at one moment, not a change over time, and a business that tracks a trend on a pie will miss the direction. Use a line for time, a bar for comparison, and a pie only for a share.
The fourth mistake is hiding the bad numbers. A dashboard that only shows the good months gives the owner a false picture, and the bad month arrives as a surprise. Show the full year, good and bad, and let the team see the truth.
The fifth mistake is measuring success by dashboards built instead of decisions made. A business that builds ten dashboards but changes nothing is not data driven, even when the screens look impressive. Track the decisions each dashboard caused, and retire the ones that caused none.
A Two Week Plan for Testing a Tool on Your Own Sales Data
Week one is the upload, and it should be honest. Pick your real sales file, messy as it is, and upload it to the tool under test. Build three charts, the best product, the worst month, and the trend by channel, then read the AI summary beside each one. A test chosen from real data beats a test chosen from a demo every time.
Week two is the sharing. Show the dashboard to a partner, ask what they understand from it, and watch where they get confused. Check whether the numbers matched the ledger, whether the forecast seemed sane, and whether the charts read well on a phone. A tool that survives a real partner review is worth more than ten that only look good in a demo.
The second week is also the time to test the refresh. Change one number in the source file, refresh the dashboard, and check whether the chart updated. A tool that needs a fresh upload for every change will cost the team hours every month, so find that out now.
After two weeks, the charts decide, not the demo. Count the charts built, the decisions made, and the hours saved. A tool that produces three decisions in two weeks earns its subscription, while one that produces none should be dropped, whatever its demo promised.

Best Pick by Job
No single tool fits every business, so each common job below is matched to the tool that scored highest for that job. The best ai data visualization tools for small businesses for a shop owner look different from the right pick for a software team, and the table below makes that split clear.
| Job | Best pick | Why it wins |
|---|---|---|
| Wants deep dashboards | Tableau | Deepest charts with AI help |
| Already on Microsoft | Microsoft Power BI | Strong value inside Microsoft 365 |
| Wants fast answers | Julius AI | Chat with your spreadsheet |
| Small team wants quick dashboards | Polymer | Fast dashboards from a sheet |
| Wants predictions | Akkio | Chat, prediction and reporting together |
| Publishes charts | Flourish | Beautiful charts for the web |
| Embeds analytics for customers | Luzmo | Embedded analytics for customers |
| Wants charts plus insights | ChartPixel | Auto charts with written insights |
If your situation does not match a row exactly, take the closest one and read that review first, starting with Tableau when it fits. The gap between neighbouring tools is smaller than the gap between a decision your business makes on time and one it makes a month late, so habit matters more than a few points on a scorecard.
Frequently Asked Questions
Business owners ask the same questions before they buy a data tool, so we answered the five we hear most.
How much does a data visualization tool cost a small business?
Most tools in this ranking charge per month per user, so a business pays one plan plus any overage for extra viewers or data rows. Free plans cover small trials well, but the live connections and sharing features that save real time usually sit on paid tiers. Check the vendor site for current pricing and confirm the total before you sign, because per user pricing adds up fast.
Can I trust the AI summary of my data?
You can trust it as a starting point, and no owner should quote it without checking. A summary needs a chart beside it, while a chart needs a human eye, and the leaders cover both well. Some owners still verify every summary against the raw numbers, which works fine when the data set is small.
How long does it take to build a first dashboard?
A focused owner builds a first dashboard in a day if the data file is clean. The delay usually comes from messy data and unclear questions, not from the tool. Clean the file first, write the three questions you need answered, and build the charts for those, rather than charting everything at once.
Do these tools work with Google Sheets?
They work, but the connection quality varies and the refresh timing differs, and some tools will need a paid plan for live links. A business that lives in Google Sheets should test the connection first, prove the refresh, and then commit. Prove the live link first, because those are the dashboards that stay useful.
What happens to our dashboards if we switch tools later?
Every tool in this ranking exports charts and data to common formats, so a switch is possible but never painless. Dashboards and AI models do not transfer, and the team must rebuild them in the new tool. A switch is never painless, which is why a business should trial Tableau properly now instead of staying with a tool that no longer fits the way the team works.
Tableau Leads, but Your Data Makes the Final Call
A business can settle this in a trial by timing minutes to a first chart, counting the decisions the dashboard caused, and measuring how often the AI summary matched the real numbers. The best ai data visualization tools for small businesses prove themselves on the minutes to a chart, the decisions caused, and the accuracy of the summary, and a two week trial on your own sales data will show all three. Tableau wins our ranking on the combined score, but the right tool for your business is the one your team opens every Monday without being asked.
Run the trial on your real sales file with your real questions and your real partner, and judge the tool on the first dashboard rather than the demo. If the charts land in a day and the partner understands them, the system is working. Pick the tool that makes numbers feel easy, protect the weekly habit, and let the decisions made on time pay for the subscription many times over.