


Most websites collect traffic data that nobody ever acts on. Reports pile up, dashboards stay unread, and the same pages keep underperforming month after month while the team guesses at what visitors actually do. The top 10 website analytics tools in this guide were judged on one question, which is whether the numbers they show lead to a decision. Google Analytics leads the ranking on depth and price, while Plausible wins for teams that want clear answers without a learning curve.
We tested each tool on the same live website for two weeks, tracking real visitors, real campaigns and real conversions. We checked how quickly a new user could answer basic questions, like which pages convert and where visitors drop off, and how much setup each tool needed before the data was trustworthy. A tool that scored well had to turn raw visits into a readable story, not a pile of charts.
Google Analytics earns its place on depth, Plausible on privacy-first clarity, and the rest on narrower strengths. Some are full analytics platforms that track every click and funnel. Others are privacy-first tools that give the essential numbers in a clean dashboard. The right pick depends on whether the team needs deep analysis or fast answers, and on how much they care about visitor privacy.
Google Analytics leads the combined score, yet a site team judging it against one reporting question should read the best pick by job table near the end before the overall order. A tool that ranks sixth overall can still be the right answer for a team that needs session recordings, just as the overall winner can be wrong for a small site that needs a dashboard anyone can read. Read the whole guide, then match the tool to the questions that need answering, not to the rank.
In this article
- The 10 Tools at a Glance
- Why the Top 10 Website Analytics Tools Change What a Site Earns
- How We Put Each Analytics Tool Through Its Paces
- The 10 Tools in Detail
- The Five Numbers Worth Checking Every Week
- Mistakes That Make Analytics Useless
- Best Pick by Job
- Frequently Asked Questions
- Settling the Analytics Call for Your Site
The 10 Tools at a Glance
The table below puts one row per tool, with the price shape, the natural fit for a buyer, and the strength that put Google Analytics first. The top 10 website analytics tools are not always the most powerful, and the table shows why. Google Analytics leads on depth at no cost, while Hotjar wins for teams that need to see what visitors actually do on a page.
| Tool | Starting price | Best for | Standout strength |
|---|---|---|---|
| Google Analytics | Free plan; paid plans on the vendor site | Teams that want depth for free | Complete traffic and conversion data |
| Plausible | Pricing on the vendor site | Small teams that want simple numbers | Clean dashboard with no cookies |
| Fathom | Pricing on the vendor site | Privacy-first sites and blogs | Simple stats with strong privacy |
| Matomo | Free plan; paid plans on the vendor site | Teams that want to own their data | Self-hosted with full data control |
| Mixpanel | Free plan; paid plans on the vendor site | Product teams tracking behaviour | Event and funnel analysis |
| Heap | Free plan; paid plans on the vendor site | Teams that want automatic capture | Captures every click without setup |
| Hotjar | Free plan; paid plans on the vendor site | Teams that need to see user behaviour | Heatmaps and session recordings |
| Microsoft Clarity | Free plan; paid plans on the vendor site | Teams that want recordings for free | Free heatmaps and session replay |
| Adobe Analytics | Pricing on the vendor site | Large teams with complex sites | Enterprise reporting and segments |
| Statcounter | Free plan; paid plans on the vendor site | Small sites that want simple stats | Lightweight visitor tracking |
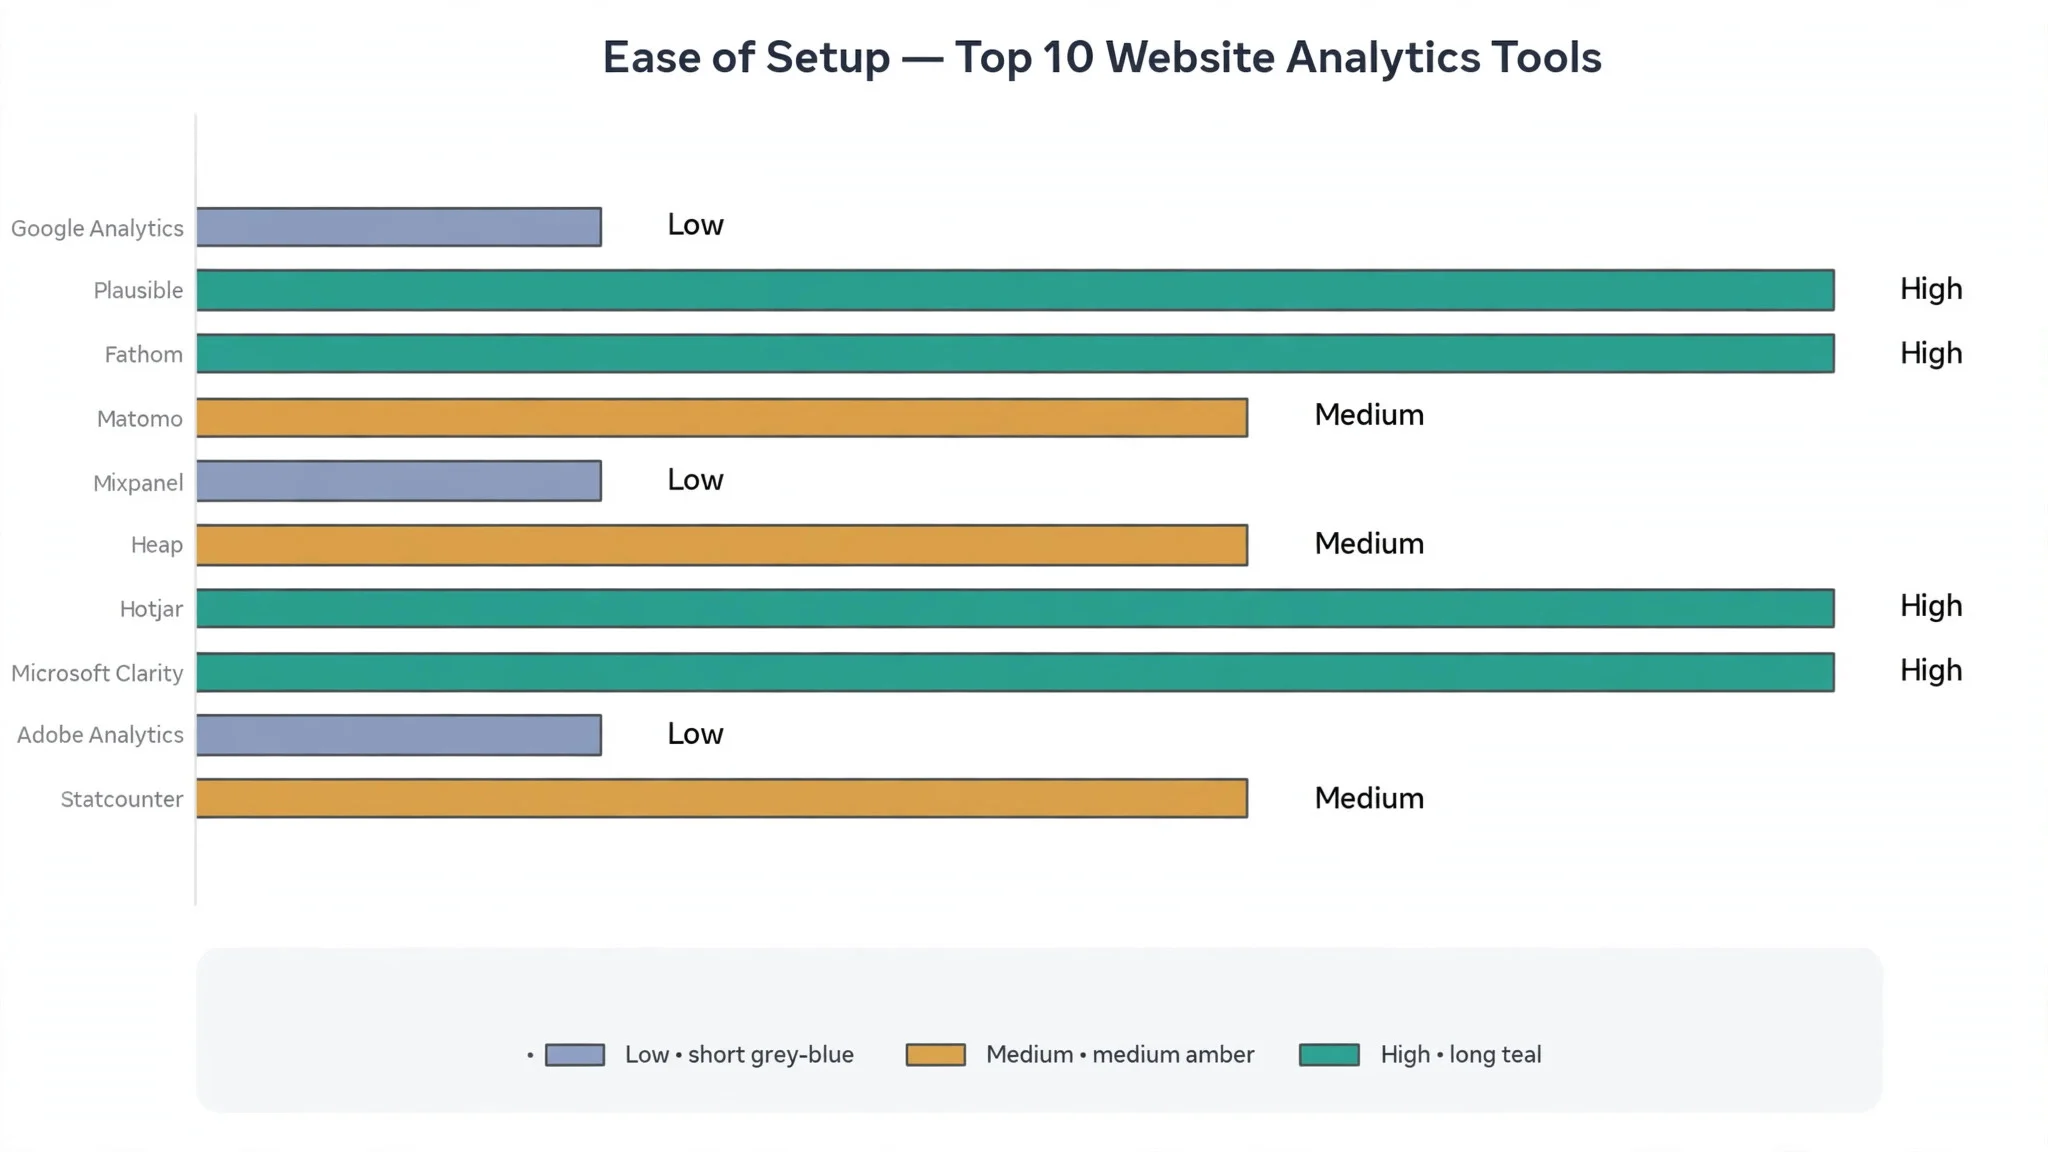
Google Analytics and Plausible lead the table, so compare their reviews on reporting clarity to see which one answers your site’s questions. A tool that scores High on depth is only useful if someone on the team can read its reports, and a tool that scores High on simplicity is only useful if it answers the questions that matter. Fit to the team’s actual questions matters more than a long feature list.
Why the Top 10 Website Analytics Tools Change What a Site Earns
The first reason is that guesswork costs money. A business that spends on ads without knowing which pages convert is paying for traffic that never becomes revenue. Analytics shows which campaigns bring buyers and which bring browsers, so the budget moves to what works and stops feeding what does not.
The second reason is that small fixes compound. A checkout page that loses one visitor in five to a confusing form, a landing page that loads slowly on phones, and a blog post that ranks but never converts are all fixable once the data shows them. The top 10 website analytics tools pay for themselves through these fixes, because each one lifts conversion a little and the gains stack up.
The third reason is that content decisions get better. A team that knows which articles bring subscribers and which bring nothing can stop writing the second kind. Analytics turns content from a guessing game into a record of what the audience actually reads, shares and acts on.
The fourth reason is that technical problems surface early. A sudden drop in traffic from one country, a page that stops loading on one browser, or a form that breaks after an update all show up in analytics before customers complain. Catching them in hours instead of weeks protects revenue and reputation alike.
The final reason is that privacy rules now shape every choice. Visitors expect their data to be handled carefully, and regulators enforce it. A tool that tracks without cookies, or that keeps data on the site owner’s own server, removes a whole category of risk. That protection is now part of the value, not an extra.
How We Put Each Analytics Tool Through Its Paces
We tested the top 10 website analytics tools against the same five measures, on the same website with the same traffic, over the same two weeks. Each tool tracked the same visitors, so Google Analytics and the rest compare like with like.
- Clarity of reporting, judged by how quickly a new user could answer which pages convert, where visitors drop off, and which campaigns bring buyers.
- Setup speed, timed from account creation to trustworthy data, including how much code or configuration the site needed.
- Depth of analysis, measured by how far the tool could go beyond page views, into funnels, segments, cohorts and custom events.
- Privacy handling, scored on cookie requirements, data ownership, and how clearly the tool explains what it collects.
- Daily usability, judged by how fast the team could answer which pages converted and how often anyone needed help reading a report.
Each measure carried equal weight except clarity of reporting, which counted double, because an analytics tool that cannot explain the numbers quickly is not doing its job. Scores run out of 100, and the order below follows the combined total, led by Google Analytics on depth of analysis. Where two tools tied, we broke the tie on setup speed, since a tool that takes a week to configure delays every decision it should inform.
We also checked the mobile experience, because site owners check traffic away from a desk. The best tools in this ranking let a manager see yesterday’s numbers and the top converting pages from a phone in under a minute, while the weakest need a desktop for anything beyond a headline figure.
The 10 Tools in Detail
Each review below follows the same pattern for Google Analytics, and every other tool is judged on the same ground. We note what each tool does best, where it falls short, and the buyer it suits best, with clarity of reporting carrying the most weight.
1. Google Analytics
Google Analytics is the standard analytics platform in this ranking, and it leads because it covers almost everything a site needs at no cost. Traffic sources, page performance, conversions, audiences and real-time visitors all sit in one system, and the integrations with advertising and search tools mean the data connects to the campaigns that produced it. For a team willing to learn the interface, the depth is unmatched for the price.
The trade off is complexity. The interface is dense, the learning curve is real, and the privacy handling needs configuration to meet strict rules in some regions. Small teams often use only a fraction of what the platform offers, and the reports can confuse more than they clarify at first. For a team that invests the learning time, that depth becomes the reason to stay.
In the trial, set up one conversion event that matters, like a purchase or a form submission, then check whether the reports show which pages and campaigns produced it. Ask a colleague who has never used the tool to find the top three converting pages without help. If they can, the setup is clear enough to last.
Our verdict. The deepest analytics here at no cost, and the best all rounder for teams that learn the interface.
2. Plausible
Plausible is the simple analytics tool, and it earns second place by giving the essential numbers in a dashboard anyone can read. Page views, visitors, sources, top pages and goals appear on one clean screen, with no cookies and no personal data collected. The script is light, so it does not slow the site, and setup takes minutes rather than hours.
The trade off is depth. Plausible deliberately skips the advanced analysis, so there are no complex funnels, no cohort reports and no deep segmentation. A product team that needs event-level behaviour analysis will outgrow it. For a small team that wants to know what is working today, that simplicity is the point.
In the trial, install the script and check the dashboard after one day of real traffic. See whether the top pages, the traffic sources and the goal completions are all visible without clicking through menus. If the morning check takes two minutes and the numbers are clear, the tool fits the team’s rhythm.
Our verdict. The clearest simple dashboard here, ideal for small teams that want fast answers.
3. Fathom
Fathom is the privacy-first pick, and it suits sites where visitor trust matters as much as the numbers. It tracks the essentials, page views, sources, top content and goals, without cookies and without collecting personal data. The dashboard is clean, the script is light, and the privacy story is simple enough to explain to visitors in one sentence.
The trade off is that the reporting stays deliberately narrow. There is no session recording, no funnel builder and no deep event analysis, so teams that need behaviour detail will want a second tool beside it. For a blog, a small business site or a publication that values privacy, the narrow scope is a fair trade.
In the trial, compare its numbers with the existing analytics for one week to confirm they line up. Check whether the goal tracking covers the conversions that matter, and whether the dashboard answers the daily questions without extra clicks. If the numbers match and the morning check is quick, the privacy gain costs nothing in practice.
Our verdict. The strongest privacy story here, ideal for sites that put visitor trust first.
4. Matomo
Matomo is the data-ownership pick, and it fits teams that want their analytics on their own server. The platform covers traffic, behaviour, goals, funnels and heatmaps, and the self-hosted option means the data never leaves the organisation’s control. It can import historical data from other tools, which makes switching less painful than it looks.
The trade off is maintenance. Self-hosting means the team owns updates, backups and server costs, and the cloud version costs more than the simplest tools. The interface is also denser than Plausible or Fathom, so new users need time to learn it. For a team with privacy rules or data policies that forbid third-party tracking, that control is the reason to choose it.
In the trial, run the cloud version first and set up one funnel for the main conversion path. Check whether the funnel shows where visitors drop off, and whether the heatmap adds anything the numbers alone miss. If the funnel reads clearly, the depth justifies the extra setup.
Our verdict. The best data ownership here, ideal for teams with strict privacy or data rules.
5. Mixpanel
Mixpanel is the behaviour specialist, and it earns its place with event and funnel analysis built for product teams. Instead of page views, it tracks what users actually do, which buttons they click, which features they use, and where they stop. Cohorts, retention curves and funnel breakdowns show how behaviour changes over time, which page-view tools cannot do.
The trade off is that it is built for products, not content sites. A blog or a brochure site will find the event setup heavy for the value it returns, and the pricing grows with event volume. For a SaaS product or an app where user behaviour decides revenue, that focus is exactly right.
In the trial, define three events that matter, like signup, first key action and upgrade, then build one funnel through them. Check whether the funnel shows the drop-off clearly and whether the cohort view reveals which signup source retains best. If both answer real questions, the tool earns its place in the stack.
Our verdict. The strongest behaviour analysis here, ideal for product teams tracking user actions.
6. Heap
Heap is the automatic-capture pick, and it suits teams that want data without deciding in advance what to track. It records every click, form submission and page view automatically, so the team can define events retroactively instead of instrumenting the site first. That means a question asked next month can be answered from data already collected.
The trade off is noise. Automatic capture collects everything, so the team must work to organise the data into useful events and funnels. The pricing also grows with the volume captured. For a team that keeps discovering new questions after the fact, the retroactive power is worth the tidying.
In the trial, let it collect data for a week, then define an event retroactively and check whether the history is there. Build one funnel from the retroactive events and see if it reads clearly. If the history answers a question the team could not have planned for, the automatic capture is doing its job.
Our verdict. The best automatic capture here, ideal for teams that ask new questions often.
7. Hotjar
Hotjar is the behaviour-visibility pick, and it fits teams that need to see what visitors actually do on a page. Heatmaps show where people click and how far they scroll, session recordings show real visits unfolding, and short surveys capture the reason behind the numbers. The combination turns a confusing page into an obvious fix.
The trade off is that it is not a full analytics platform. Hotjar shows behaviour on individual pages but does not replace traffic and conversion reporting, so most teams run it beside Google Analytics or a similar tool. The free plan is generous, and the paid tiers scale with the number of sessions recorded.
In the trial, watch ten session recordings on the highest-traffic landing page and note where visitors hesitate or leave. Compare those moments with the heatmap, and check whether the pattern points to one fix. If a single change suggests itself from the recordings, the tool has paid for itself.
Our verdict. The best view of real visitor behaviour here, ideal for teams fixing confusing pages.
8. Microsoft Clarity
Microsoft Clarity is the free-recordings pick, and it earns its place by offering heatmaps and session recordings at no cost with no session limits. It shows rage clicks, dead clicks and excessive scrolling, which point straight at the broken parts of a page. It plugs into Google Analytics, so the recordings sit beside the traffic data they explain.
The trade off is that the analytics side is thin. Clarity is a behaviour tool, not a traffic platform, so it needs a partner for sources, conversions and funnels. The dashboard is also simpler than Hotjar’s, with fewer survey and feedback features. For a team that wants recordings without paying, that thinness is easy to accept.
In the trial, filter the recordings to sessions that ended without a conversion and watch five of them. Note the exact moment each visitor gave up, and check whether the same spot appears in the heatmap. If the pattern repeats across sessions, the fix is clear and the tool has done its job.
Our verdict. The best free behaviour recordings here, ideal for teams that want heatmaps without a bill.
9. Adobe Analytics
Adobe Analytics is the enterprise platform, and it fits large teams with complex sites and many segments. It handles huge traffic volumes, deep segmentation, custom variables and reporting that can be shaped to almost any question. Organisations already using the wider Adobe suite get integrations that tie analytics to content, campaigns and customer data.
The trade off is cost and complexity. Adobe Analytics is priced for enterprises, implementation takes real expertise, and the interface rewards trained analysts rather than casual users. A small or mid-sized site will find it heavy and expensive. For a large organisation with a dedicated analytics team, it is the most capable platform here.
In the trial, ask the analytics lead to build one segment that matters, like returning visitors from one campaign, and check whether the report answers the question without a workaround. If the segment builds cleanly and the numbers are trusted, the platform’s depth is real.
Our verdict. The most capable enterprise analytics here, ideal for large teams with dedicated analysts.
10. Statcounter
Statcounter is the lightweight pick, and it suits small sites that want simple visitor stats without a heavy setup. It shows visitors, page views, sources, popular pages and recent visitor paths in a straightforward dashboard, with a free plan that covers small sites. The script is light, and the recent-visitor view helps a small owner see what is happening right now.
The trade off is depth and modern polish. Statcounter does not offer funnels, cohorts or advanced segmentation, and the interface feels older than the leaders. For a small site that needs to know who visited and what they read, that simplicity is enough, and the price is hard to beat.
In the trial, check the dashboard after a day of real traffic and see whether the top pages and sources are clear. Look at the recent visitor paths to see how people move through the site, and check whether the numbers match the existing analytics. If they line up, the tool is a sound lightweight choice.
Our verdict. The simplest lightweight tracking here, ideal for small sites that want the basics.
The Five Numbers Worth Checking Every Week
Most analytics dashboards show fifty numbers, but only five decide what to do next. The first is the conversion rate on the main goal, because it is the number the business actually earns from. Track it weekly, and treat any sudden move as a signal to investigate, not as noise. The top 10 website analytics tools all report it, but only a team that looks at it weekly gets the value.
The second is the top entry pages, because they show where visitors actually arrive. A page that brings the most traffic but converts the worst is the highest-value fix on the site. Improve its message, its speed or its call to action, and the whole site’s numbers move.
The third is the drop-off point in the main funnel. Every site has one step where most visitors leave, whether it is the pricing page, the signup form or the checkout. Find that step, watch recordings of visitors reaching it, and fix the friction there before touching anything else.
The fourth is the traffic source mix. A site that depends on one channel is fragile, and a channel that brings visitors who never convert is a cost, not a win. Check the mix monthly, and shift effort toward the sources that bring buyers, not just visits.
The fifth is mobile performance. Most traffic now arrives on phones, and a page that works on a desktop but stutters on a phone loses half its audience silently. Check the mobile conversion rate separately, and treat a gap between mobile and desktop as a problem to fix, not as normal.

Mistakes That Make Analytics Useless
The first mistake is tracking everything and reading nothing. A tool that collects fifty events nobody reviews is decoration. Pick five numbers that matter, put them in a weekly routine, and ignore the rest until a specific question needs them.
The second mistake is trusting data before checking the setup. A tracking code installed twice doubles the numbers, a missing code on one page hides a whole section, and a filter set wrongly can erase real traffic. Check the setup with a real visit in the first week, and re-check it after every site change.
The third mistake is judging a change after one day. Traffic varies by day of the week, by season and by campaign, so a single day’s numbers prove nothing. Wait for a full week, compare with the same week before, and only then decide whether the change worked.
The fourth mistake is confusing correlation with cause. A page that gets more traffic is not necessarily the reason sales rose, and a campaign that brings visitors may not be the one that brings buyers. Check the conversion path, not just the volume, before giving any page or campaign the credit.
The fifth mistake is ignoring privacy rules. Tracking that collects personal data without consent can breach regulations and damage trust. Choose the privacy handling that fits the audience and the law, document what is collected, and review it yearly.
Best Pick by Job
A single winner does not fit every site, so we matched each common situation to the tool that scored highest for that job. The top 10 website analytics tools for a small blog look different from the right pick for a product team, and the table below makes that split clear.
| Job | Best pick | Why it wins |
|---|---|---|
| Wants depth at no cost | Google Analytics | Complete data with no bill |
| Needs a dashboard anyone can read | Plausible | Clean numbers with no cookies |
| Puts visitor privacy first | Fathom | Simple stats with strong privacy |
| Must own the data outright | Matomo | Self-hosted with full control |
| Tracks what users do, not just pages | Mixpanel | Event and funnel analysis |
| Wants data without advance setup | Heap | Automatic capture, retroactive events |
| Needs to see real visitor behaviour | Hotjar | Heatmaps and session recordings |
| Wants recordings for free | Microsoft Clarity | Free heatmaps and session replay |
| Runs a large site with analysts | Adobe Analytics | Enterprise reporting and segments |
| Runs a small site on a budget | Statcounter | Lightweight tracking for free |
If your situation does not match a row exactly, take the closest one and read that review first, starting with Google Analytics when it fits. The gap between neighbouring tools is smaller than the gap between a team that reads its numbers weekly and one that never opens the dashboard, so the habit matters more than a few points on a scorecard.
Frequently Asked Questions
Site owners ask the same questions before every analytics change, so we answered the most common ones here. The top 10 website analytics tools answer these in their help centres, but the plain answers below are faster to judge a tool against.
How long does it take before the data is trustworthy?
A day of traffic gives a rough picture, but a full week is the minimum for decisions, because traffic varies by day. Wait for two weeks before judging a change, and compare like with like, such as the same weekday a week apart. A tool that shows real-time data is useful for checking the setup, not for judging performance.
Do privacy-first tools collect less useful data?
They collect less personal data, but the numbers that matter, like page views, sources and goal completions, are still there. What they skip is the individual-level tracking, such as following one visitor across many visits. For most small and mid-sized sites, the aggregate numbers answer every real question.
Can I run two analytics tools at the same time?
Yes, and many teams do, usually a traffic platform beside a behaviour tool. Running two full traffic platforms can double-count if the setup is wrong, so check that each tool is installed once and that the numbers line up. Use one as the source of truth for traffic, and the other for the questions it answers best.
What is the difference between a heatmap and a session recording?
A heatmap aggregates many visits into one picture, showing where people click and how far they scroll. A session recording shows one real visit unfolding, with the mouse, the pauses and the exact moment the visitor left. Heatmaps show the pattern, recordings show the reason, and together they explain a page better than either alone.
Will analytics slow my website down?
A heavy tracking script can add load time, especially if several tools run at once. The lightweight tools in this ranking add very little, while the full platforms add more. Check the site speed before and after installing a tool, and remove any tool that is not being read. Speed is part of the user experience, and a slow site loses visitors before analytics can even count them.
Settling the Analytics Call for Your Site
A site team can settle this in a trial by timing the morning check, testing whether the tool answers which pages convert, and confirming the setup can be trusted. The top 10 website analytics tools prove themselves on the time the morning check takes, the clarity of the answer to which pages convert, and the confidence that the setup is correct, and a two week trial on the live site will show all three. Google Analytics wins our ranking on the combined score, but the right tool for a site is the one the team actually opens every week.
Run the trial on the real site with real traffic, and judge the tool on the morning check rather than the demo. If the dashboard answers the key questions in two minutes, the numbers match reality, and the privacy handling fits the audience, the tool will serve the site for years. If the reports confuse more than they clarify, no amount of depth will save it. Pick the tool that turns visits into decisions, protect the weekly check, and let the fixes it reveals pay for the choice many times over.